



To mark the 80th anniversary of Vietnam’s statistical sector (May 6, 1946 - May 6, 2026), the National Statistics Office at the Ministry of Finance published “Vietnam’s Economic Structure: 40 Years of Reform (1986-2025)”, which offers a first-time comparison of production-side and expenditure-side GDP, providing a broader perspective on how Vietnam’s economic structure has evolved over four decades of reform and highlighting several important shifts and emerging challenges.
The most significant overall development is the changing balance between domestic production GDP, representing domestic supply, and domestic expenditure GDP, representing domestic demand. The economy has shifted from a position of domestic production falling short of domestic use to one in which domestic production had exceeded domestic use by 2025.
Positive results by 2025
Prior to and during the 2006-2010 period, the ratio of production GDP to expenditure GDP was almost continually below 100 per cent, indicating a substantial shortfall in domestic production relative to domestic use.
From 1976 to 1985, before Vietnam’s reform period, its economy faced a particularly severe shortfall, with the deficit reaching double digits in percentage terms. In 1976 and 1977, it exceeded 20 per cent. The entire pool of capital accumulation, along with part of final consumption, depended heavily on large-scale foreign aid and external borrowing.
The prolonged gap between production GDP and expenditure GDP had significant consequences. Most notably, it contributed to a severe socio-economic crisis that began in the late 1970s, intensified during the 1980s, and continued into the early 1990s. Though production GDP continued to grow, its rate was low and, in some years, barely kept pace with or fell below population growth. GDP per capita measured in US dollars at the official exchange rate remained below $100 for many years. In 1988, for example, it stood at just $86, placing Vietnam among the world’s lowest-income countries and territories.

The shortfall of production GDP relative to expenditure GDP continued through 2010. From 2011 to 2025, however, production GDP exceeded expenditure GDP in 12 of the 15 years. This represents a significant and encouraging improvement, marking a shift from an economy in which domestic production was insufficient to one in which domestic production exceeded domestic use.
The improvement in the balance between production GDP and domestic expenditure GDP has also been reflected in other socio-economic indicators. Economic growth has continued through 2025 despite the impact of the Global Financial Crisis and economic downturn that began in late 2008, the systemic transition crises in Eastern European socialist countries and the Soviet Union, and the Covid-19 pandemic.
Production GDP measured in US dollars at the official exchange rate increased from $5.48 billion in 1988 to $514 billion in 2025; a 93.8-fold increase. GDP per capita, measured in US dollars at the official exchange rate, rose from just $86 in 1988. Twenty years on, in 2008, Vietnam moved out of the low-income group and into the lower-middle-income group. Seventeen years after that, in 2025, it moved into the upper-middle-income group; three years earlier than the global average. Hyperinflation has subsided, and inflation was kept under control from 2016 through 2025, in line with annual targets.
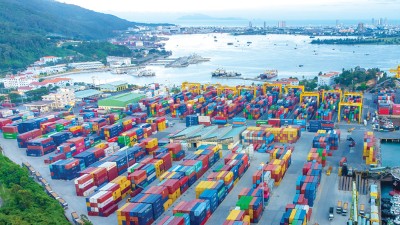
In trade, Vietnam shifted from a prolonged period of large trade deficits to a sustained trade surplus from 2016 through 2025. The surplus exceeded $20 billion in each of the past three years, reaching more than $28.1 billion in 2023. Vietnam’s foreign exchange reserves exceeded $109 billion in some years, surpassing short-term external debt and the conventional international safety threshold of three months of imports. Between 2012 and 2025, the VND depreciated against the USD in only two years; in four years, the increase was below 1 per cent, and in seven years it was below 2 per cent.
The unemployment rate, which stood at 13 per cent in 1988, has fallen to 2.28 per cent, while the underemployment rate has declined to 1.65 per cent. The proportion of households experiencing food poverty fell from 53 per cent in 1993 to 5.8 per cent in 2016, while the multidimensional poverty rate declined from 9.2 per cent in 2016 to 4.3 per cent in 2024.
Key 2026 targets
Main targets for 2026 include production GDP growth of more than 10 per cent. GDP per capita is targeted at $5,400-$5,500. Assuming average population growth of 0.95 per cent from 2025, equivalent to a population of 103.32 million, production GDP in 2026 would be estimated at $557.9-$568.3 billion, representing growth of 8.55-10.66 per cent from 2025.
The manufacturing and processing sector is targeted to account for 24.96 per cent of production GDP, while average CPI growth is expected to be around 4.5 per cent. Average social labor productivity is targeted to increase by 8.5 per cent, implying estimated growth of 1.38 per cent in the number of employed workers.
Agricultural workers are targeted to account for 25.3 per cent of total employment, while the proportion of workers holding degrees or certificates is expected to reach 29.5 per cent. The urban unemployment rate for the working-age population is targeted at below 4 per cent, while the poverty rate is expected to decline by 1-1.5 percentage points.
In the healthcare sector, the targets are 15.3 doctors and 34.7 hospital beds per 10,000 people, with health insurance coverage reaching 95.5 per cent.
In environmental management, the target is for 95 per cent of urban household solid waste to be collected and treated in accordance with applicable standards, while 95 per cent of operating industrial and export processing zones are expected to have centralized wastewater treatment systems meeting environmental standards.
These are broad targets covering the economic, social, and environmental dimensions. However, they do not include many indicators directly related to the relationship between production GDP and expenditure GDP, particularly asset accumulation, final consumption, and merchandise and services trade balances.
Developments in 2026
Actual developments as of August 15 raise several issues relevant to the relationship between production GDP and expenditure GDP.
During the first half, production GDP increased 8.18 per cent year-on-year; the highest growth rate recorded in the first half for many years. Final consumption increased 8.15 per cent, or almost in line with production GDP. Asset accumulation increased 15.2 per cent, or nearly twice the growth rate of production GDP. Overall, domestic expenditure GDP, comprising asset accumulation and final consumption, grew faster than production GDP. This suggests that production GDP may once again have fallen below expenditure GDP, returning the economy to a deficit position similar to that seen before 2010.
What is unusual is that this potential shortfall does not appear to have resulted from weak GDP growth or excessive consumption. Though the strong increase in asset accumulation would normally imply stronger development investment, given that accumulation provides the foundation for investment, actual development investment at current prices increased by only 12.9 per cent, or well below the growth of asset accumulation.
At constant prices, the gap is even wider. Moreover, the development investment-to-GDP ratio stood at only 27.3 per cent during the first half of this year; significantly below the corresponding ratio in previous years, which was above 30 per cent.
This raises the question of whether a significant portion of asset accumulation has been directed into investment channels such as speculative digital assets, gold, and real estate rather than productive investment. Prices in these markets rose sharply during the first half, with gold, for example, increasing 51.86 per cent. The CPI also rose faster than in the same period of the previous year, at 4.39 per cent compared to 3.28 per cent.
Another development that warrants attention in assessing the relationship between production GDP and expenditure GDP is the merchandise and services trade balance.
In overall trade, from the beginning of 2026 through August 15, the surplus was approximately $10 billion, compared with nearly $20.1 billion for full-year 2025. The trade surplus as a percentage of exports stood at approximately 2.9 per cent through August 15, compared with 4.2 per cent for full-year 2025.
However, the trade balance through August 15, 2026, moved in the opposite direction, with the country recording a merchandise trade deficit of $21.88 billion. This deficit represented 6.33 per cent of exports; a relatively large scale and ratio compared with the corresponding periods of previous years.
Several factors contributed to the trade deficit through August 15. At the national level, though exports grew at an unusually high rate compared with the same period of previous years, imports were larger than exports both in absolute terms, at $367.3 billion versus $345.4 billion, and in year-on-year growth terms, at 34.7 per cent versus 22.2 per cent.
By sector, exports by the domestic economic sector increased only 6.4 per cent, or significantly below the national growth rate, while its share of total exports was also lower, at 20.1 per cent versus 23.1 per cent. By contrast, imports by the domestic economic sector surged 77.4 per cent, roughly twice the national growth rate. Its share of total imports reached 26.7 per cent; higher than its 20.1 per cent share of exports.
As a result, the domestic economic sector recorded a merchandise trade deficit of nearly $28.9 billion through August 15, equivalent to nearly 29.4 per cent of exports. Both figures were substantially higher than in the same period last year, when the deficit was $19.6 billion and represented 6.9 per cent of exports.
The foreign-invested sector recorded export growth of 26.9 per cent, above the national rate and well above the domestic sector’s growth rate. It accounted for 79.9 per cent of total national exports, substantially higher than the domestic sector’s share. Imports by the foreign-invested sector increased 23.7 per cent through August 15, significantly below both the national rate and the growth rate of domestic-sector imports.
Thus, both sectors contributed to the shift in the national trade position from surplus to deficit, with the foreign-invested sector doing so through a reduction in its trade surplus.
Major categories
Several major export and import categories also contributed to the trade deficit through August 15. Export items recording declines or relatively low growth included rice, crude oil, rubber, cassava, wooden products, and products made from base metals. Major import categories recording strong growth included petroleum products, chemicals, plastic materials, precious stones and precious metals and products thereof, iron and steel products, other base metals, computers and electronic products and components, machinery, equipment and other tools and spare parts, as well as other components and parts.
Several export products also recorded lower unit prices, including coffee, coal, rice, and cassava and cassava products. Meanwhile, 14 imported products recorded higher unit prices, including coal, crude oil, petroleum products, gas, base metals, textile fiber and yarn, scrap iron and steel, and plastic materials.
Among major export markets, several recorded substantial declines during the first seven months of 2026. At the same time, 59 of 77 major import markets recorded increases, with several posting rises of more than $1 billion. Imports from China rose $37.1 billion, South Korea by more than $17.6 billion, Taiwan (China) by over $9.9 billion, the US by nearly $2.8 billion, Malaysia by more than $2.6 billion, Japan by over $2.3 billion, Thailand by more than $2 billion, Singapore by over $2.8 billion, India by nearly $1.5 billion, and Indonesia by more than $1 billion. Together, these markets accounted for over $80 billion of additional imports.
Higher imports relative to exports also reflect the continued reliance on imported inputs for production and consumption. As noted for many years, Vietnam’s support industries remain underdeveloped, while processing and assembly remain widespread, including within the foreign-invested sector. This reduces domestic value-added while simultaneously increasing import demand.
The gap between imports and exports was particularly large in several product categories, exceeding $1 billion in each case. Computers, electronic products, and components recorded a gap of $50.222 billion, followed by other base metals at $8.262 billion and petroleum products at $6.760 billion, to name just a few.
Another factor that may warrant attention is the possibility that some countries are using Vietnam as an intermediary export market to circumvent US import tariffs, contributing to a sharp increase in exports to Vietnam.
Consumption patterns among some segments of the population are another factor. There has been an early rise in spending on luxury and limited edition global brands, including among some lower-income consumers, driven in part by conspicuous consumption.
The services sector presents several notable features. First, Vietnam remains a net importer of services. Second, the services trade deficit has persisted over the years. Third, the deficit has been substantial, reaching double-digit billions of dollars in several years.
The services trade deficit as a share of services exports has also been relatively high, exceeding 30 per cent in many years. In some years, the ratio was particularly high, reaching 136.9 per cent in 2020, 198.9 per cent in 2021, and 96.8 per cent in 2022.
Among services, transportation and other services recorded the largest deficits. The transportation deficit is largely attributable to the weakness of Vietnam’s domestic transportation services, particularly maritime transport.
Tourism services also recorded deficits in several years, including $1.378 billion in 2020, $3.681 billion in 2021, $3.467 billion in 2022, and $520 million in 2024. Key contributing factors include the relatively small number of international visitors making repeat trips to Vietnam, and relatively low visitor spending. Other services, including financial, insurance, and government services, also posted trade deficits.
The objectives of the new era, characterized by the nation’s aspiration to advance and achieve greater prosperity, include achieving double-digit economic growth and moving into the high-income group within the next 20 years, by 2045. These objectives require not only faster growth in production GDP, but also stronger growth in accumulation and consumption.
Outlook for 2026
Based on developments during the first six and seven months of the year and through August 15, exports and imports for full-year 2026 could develop as follows.
Merchandise exports are projected to increase 22 per cent to $579.6 billion, while imports could rise 34 per cent to $609.7 billion, resulting in a trade deficit of around $30 billion, reversing the $20 billion surplus recorded previously.
For services, exports are projected to increase 20.5 per cent to $36.5 billion, while imports are expected to rise 19.4 per cent to $48.4 billion, resulting in a services trade deficit of $12.9 billion, higher than the $10.2 billion recorded in 2025.
Using these projections, two possible scenarios emerge for the relationship between production GDP and expenditure GDP. The first is that Vietnam could remain in a position where production GDP exceeds expenditure GDP, but with a smaller surplus than during 2011-2025.
The second is that Vietnam could return to a “shortfall” position, with production GDP falling below expenditure GDP, though the deficit would remain smaller than the level recorded before 2010.
The objectives of the new era, characterized by the nation’s aspiration to advance and achieve greater prosperity, include achieving double-digit economic growth and moving into the high-income group within the next 20 years, by 2045. These objectives require not only faster growth in production GDP, but also stronger growth in accumulation and consumption. In other words, the fundamental economic balance between production GDP and expenditure GDP will need to improve beyond the levels achieved during 2011-2025.







 Google translate