


The first quarter of 2026 - the opening of what has been described as a new era of the nation’s rise - exhibited both bright spots and areas of concern in terms of Vietnam’s economic performance and provide a basis for assessing prospects in the quarters to come. Results in the quarter can be viewed from several angles.
Strong GDP growth
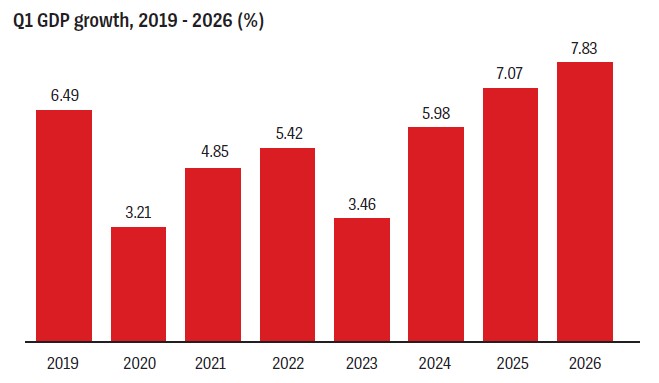
In terms of GDP, one key bright spot in recent years has been the pace of growth. GDP growth in the first quarter of 2026 ranked among the highest in the opening quarter for the past seven years.
Notably, it not only exceeded the levels recorded in the first quarter of 2020 and 2021, when growth was affected by the Covid-19 pandemic, but also surpassed the first quarter of 2019, prior to the pandemic, as well as the first quarter of 2023, 2024, and 2025. It was lower only than the first quarter of 2022, when growth was partly boosted by a very low comparison base in the first quarter of 2021. This outcome reflected clear signs of recovery, supported by strong determination, effective governance, and the efforts of businesses and the broader population.
The strong growth was even more notable given the conditions under which it was achieved. The comparison base in the first quarter of 2025 was already relatively high, while exports to the US have faced increasing difficulties since the second half of last year due to higher import tariffs.
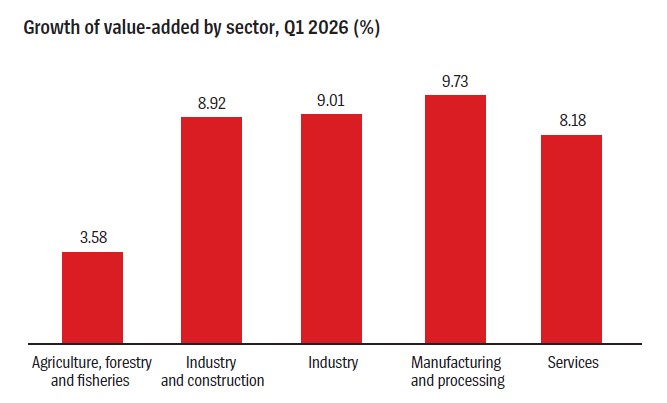
Growth in GDP has been recorded across sector groups. Industry and construction, the largest segment of the real economy, posted the fastest growth. Meanwhile, the services sector, which absorbs the largest share of labor and capital, also expanded at a rate above the overall average.
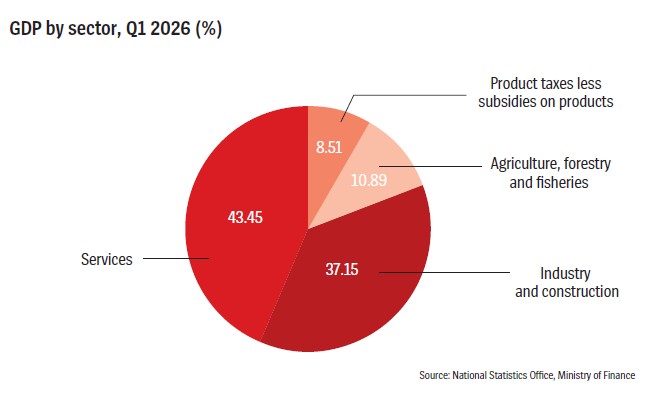
Differences in growth rates have led to a positive structural shift. The share of agriculture, forestry, and fisheries continues to decline and remains significantly lower than its share of employment, indicating that workplace productivity in the sector remains the lowest among the three major sectors. This underscores the need not only to raise the share of trained workers but also to accelerate the shift of workers from agriculture to higher productivity sectors such as industry, construction, and services.
The share of employment in industry and construction continued to rise and exceeded its share of GDP, indicating that workplace productivity in the sector is above the national average and the highest among the three sectors. This calls for further improvements in workforce skills, a reduction in reliance on processing and assembly, and faster modernization through the development of the digital economy and high-tech industries such as semiconductors.
The services sector also continued to expand its share and exceeded its contribution to GDP, suggesting productivity above the national average and second only to industry and construction. While this is a positive development, the share of services in Vietnam’s GDP remains significantly lower than in many other countries and continues to be a structural weakness.
Growth quality also improved compared with the same period last year. The Index of Industrial Production (IIP) rose 9 per cent, slightly below value-added growth of 9.01 per cent. Manufacturing grew 9.7 per cent, lower than value-added growth but higher than in the same period of last year, indicating a reduction in intermediate input costs. The Incremental Capital-Output Ratio (ICOR) declined to below 5, reflecting improved investment efficiency.
GDP growth outpaced the increase in the number of employed workers (7.83 per cent vs. 1.3 per cent), resulting in workplace productivity growth of an estimated 6.64 per cent. As investment efficiency and workplace productivity improve, supported by the application and upgrading of technology, the contribution of Total Factor Productivity (TFP) to GDP growth is estimated at around 45 per cent; the highest among the main growth drivers.
From the expenditure perspective, several issues emerged. The growth of asset accumulation was lower than GDP growth (7.18 per cent vs. 7.83 per cent), reducing the accumulation-to-GDP ratio to about 23.7 per cent from 24 per cent a year prior. As accumulation underpins investment, the investment-to-GDP ratio also declined. This is a point of concern, as investment is a key driver of GDP growth, and a lower ratio could make it more difficult to achieve this year’s targets.
Final consumption grew faster than GDP, at an estimated 8.45 per cent. The share of final consumption in GDP increased compared with the first quarter of last year, making it an important contributor to overall growth. Stronger domestic demand played a key role in supporting this expansion.
However, despite the increase in domestic demand (asset accumulation plus final consumption), the goods trade balance shifted from a $3.17 billion surplus to a $3.64 billion deficit.
Concerning inflation signals
Inflation remains a key macro-economic indicator closely linked to market participants, and the first quarter exhibited both positive and concerning signals.
Average CPI rose 3.51 per cent, higher than the 3.13 per cent posted in the same period of 2025 but still considered a positive outcome given stronger inflationary pressure. Cost-push factors have intensified, with price increases occurring in earlier stages of production. There are also emerging signs of imported inflation.
In the broader relationship between production and GDP use, final consumption grew faster than both GDP and in the same period of last year (8.45 per cent compared to 7.83 per cent), while the trade balance shifted from a $3.16 billion surplus to a $3.64 billion deficit. Retail sales of goods and services rose 10.9 per cent, higher than the 9.9 per cent recorded a year earlier, though real growth, excluding price effects, was 7 per cent; slightly lower than previously.
On the monetary side, growth in key indicators slowed compared to the same period last year. Money supply increased by 1.04 per cent against 1.99 per cent, deposits rose 0.44 per cent against 1.36 per cent, and credit grew 2.15 per cent against 2.49 per cent. These developments helped contain inflation.
On the fiscal side, revenue growth slowed, to 11.4 per cent compared to 29.3 per cent in the first quarter last year, expenditure growth accelerated, to 23.1 per cent compared to 11.6 per cent, and the budget surplus narrowed to VND84.9 trillion ($3.27 billion), down from VND99.5 trillion ($3.83 billion).
Psychological factors had a stronger impact than in the same period of 2025. Average gold prices surged sharply, while the USD increased more modestly due to tighter exchange rate management. The relatively stable exchange rate influenced trade flows and contributed to the shift from surplus to deficit.
Q1 trade deficit
A trade deficit was posted in the first quarter of 2026, reversing a trend seen in the opening quarter for the past two years (the first quarter of 2024 saw a $8.7 billion surplus and of 2025 a $3.16 billion surplus, while the first quarter of 2026 saw a $3.64 billion deficit).
Exports in the quarter faced significant difficulties compared to a year earlier. In addition to a relatively stable VND/USD exchange rate, higher US import tariffs and rising import prices weighed on performance. Despite this, exports to the US still generated a large surplus in absolute terms ($39 billion compared to $31.4 billion), while imports from China rose sharply ($50.1 billion compared to $38.1 billion).
The services balance remained in deficit. Compared with the same period last year, export growth slowed (19.2 per cent compared to 21.8 per cent), while import growth also eased (16.9 per cent compared to 18 per cent), resulting in a services deficit of $1.68 billion in the first quarter compared to $1.64 billion last year.
Meanwhile, international tourism continued to recover strongly, with Vietnam welcoming 6.67 million international visitors in the quarter, up 12 per cent year-on-year and marking a new record. Two markets exceeded 1 million visitors, with China contributing more than 1.4 million and South Korea nearly 1.33 million.
Outlook & solutions
Based on first-quarter results, including both bright spots and emerging concerns, along with factors likely to influence the economy, what can be expected for Vietnam’s economy in the quarters ahead under more ambitious targets?
GDP
First, GDP indicators remain the top priority for this year and for the broader trajectory of the new era.
Following the pattern observed in previous years, production GDP growth tends to accelerate from the second quarter onwards through to the end of the year, as input factors - including investment capital, labor, technology imports, monetary policy, and fiscal spending - and output factors such as domestic consumption and exports move from initial implementation into a phase of stronger expansion. On that basis, GDP growth is expected to pick up in the second quarter, with the third and fourth quarters potentially reaching double-digit levels.
This outlook could materialize under the influence of several factors. Total social investment is expected not only to increase in scale, reflected in a rising share relative to GDP, potentially reaching 35 per cent, but also to improve in efficiency, as the ICOR declines to below 4.5. Greater emphasis should be placed on channeling capital into productive business activities, rather than speculative assets such as gold, cryptocurrencies, and real estate.
The number of employed workers is expected to rise as unemployment declines. More importantly, workplace productivity growth could remain strong, supported by a higher share of workers in more productive sectors such as industry, construction, and services, as well as by the proportion of trained workers surpassing 30 per cent for the first time.
The contribution of TFP to GDP growth is expected to approach 50 per cent, exceeding the contributions of capital and labor. This will be driven by improved investment efficiency, rising workplace productivity, greater technological adoption, and the expansion of enterprises with higher technological capabilities, alongside the continued development of the digital economy.
An important driver of both economic growth and social welfare is the development of businesses and entrepreneurs. The number of enterprises entering the market in the first quarter exceeded those exiting (96,000 vs. 91,800), pushing the total number of active enterprises nationwide to above 1 million for the first time; a target originally set for 2020 but only now achieved. Continued support for startups and for businesses facing difficulties, to prevent market exit and enable re-entry, remains essential. At the same time, it is important to reverse the declining share of business owners within total employment, which has fallen steadily over the years.
Concerns remain. The investment-to-GDP ratio has for many years exceeded that of asset accumulation, including in periods of budget deficits. This represents a potential risk, particularly as corporate profitability remains low and many enterprises continue to incur losses.
The longstanding issue of reliance on processing and assembly has been widely recognized but improvements remain tardy.
Overall, GDP growth in 2026 as a whole is expected to exceed the 8.02 per cent posted in 2025, but is unlikely to reach the targeted double-digit level.
Inflation
Inflation remains a key concern. From a conceptual standpoint, the view that inflation is not driven by monetary factors is fundamentally flawed. At its core, inflation reflects a depreciation of currency - when money supply exceeds goods supply. Monetary policy affects not only inflation but also growth, requiring a balance between tightening to control inflation and easing to support expansion.
To achieve higher GDP growth, policymakers may aim to increase the investment-to-GDP ratio. However, any move toward monetary easing must be carefully calibrated in light of current economic conditions. A key issue is the relationship between the scale and growth of money supply and the corresponding scale and growth of GDP.
A significant concern is the allocation of capital into speculative assets such as gold, real estate, and cryptocurrencies. While this has so far primarily driven price increases in those markets, any correction could spill over into goods and services, creating broader inflationary pressures. Gold prices have doubled or tripled since mid-2020, while real estate prices have more than doubled since mid-2022, with the upward cycle already lasting four to six years.
Cryptocurrencies remain highly volatile, gold prices have diverged significantly from global levels, and stock markets are vulnerable to speculation and market manipulation.
Cost-push pressures are also building. Though price increases in earlier stages of production have not yet fully transmitted to consumer prices, they are likely to do so over time through the production and distribution chain.
Imported inflation is another major risk, particularly as global prices rise and higher US tariffs drive up import costs.
Balance of payments
The balance of payments warrants close attention. Vietnam has recorded continuous trade surpluses for decades. While this provides a strong foundation, it also presents new challenges arising from domestic structural weaknesses and an evolving global environment.
One of the most prominent constraints is the continued reliance on processing and assembly, which persists in both the domestic and foreign-invested sectors. This not only limits national income - with gross national income remaining around 95 per cent of GDP - but also contributes to rising imports. The trade surplus has been narrowing in recent years and is expected to decline further in 2026, with the first quarter already in deficit. The ratio of trade surplus to total exports has also fallen sharply.
Exports have largely depended on the foreign-invested sector, while the domestic sector continues to run significant deficits. Improving export performance requires addressing structural weaknesses, particularly low workplace productivity and competitiveness that still relies heavily on low labor costs. The gap between purchasing power parity and the official exchange rate remains large, exceeding 3.5-times.
Exchange rate policy remains a critical lever. While depreciation could support exports, it would also raise import costs, increase inflationary pressure, and create risks related to external debt and trade disputes.
Though the exchange rate rose significantly last year, it remained relatively stable in the first quarter of this year. Import prices, however, especially for fuel, increased sharply. There is a risk that imports will continue to rise in both volume and value. If prices rise further and the VND depreciates, imported inflation could return, as seen in previous periods.
Overall, the trade balance is likely to weaken further this year and could shift into a full-year deficit. Meanwhile, the services balance is expected to remain in deficit. This combination will directly affect GDP growth from both the production and expenditure perspectives and should be viewed as a significant warning sign.
The services deficit has persisted for years, often reaching double-digit levels. It is most pronounced in transport and other services, including insurance, finance, and government services. Even tourism, which previously generated surpluses, has in some years shifted into deficit.
The financial account, meanwhile, has remained in surplus, driven mainly by FDI, while other forms of investment have often recorded negative balances.

![[Interactive]: Economic overview - Q1/2026](https://premedia.vneconomy.vn/files/uploads/2026/04/07/9b1d8143d2eb4bbea0b2f4d05e422e89-81336.png?w=400&h=225&mode=crop)


 Google translate